Executive Summary
A growing crisis in mathematics education is undermining student success. With the average performance of U.S. students on the decline, there is an urgent need to develop targeted interventions that will help establish foundational understanding and equip students with the mathematical reasoning abilities essential for success in the modern world.
A first step in that process is determining where students are most likely to have challenges, and which skills they most often struggle to master. Drawing on data from the National Assessment of Education Progress (NAEP), the Program of International Student Assessment (PISA), and ASSISTments, this report sought to identify the most challenging concepts and suggest strategies to improve instruction and outcomes.
Key Findings: Where Students Struggle With Math
- Data analysis, statistics, probability, and geometry are among the concepts and skills that students most often struggle to master. NAEP exam results indicate that these topics are especially difficult for students, even for those who reported putting in significant effort. Data from ASSISTments, a free, evidence-based online mathematics learning platform, also indicated that understanding the relationship between independent and dependent variables, a data analysis component, is one of the most challenging 6th-grade concepts. However, average scores of high-performing students in the NAEP exam suggest that Geometry may pose a greater challenge overall. Additionally, average scores of the PISA exam indicate space and shape as the most challenging concept for students.
- Student struggles in these areas may be rooted in a weak foundation in basic concepts. Difficulties with advanced topics often stem from earlier gaps in understanding. Because mathematics builds cumulatively, students who struggle with algebra may be facing unresolved challenges with fractions, number sense, or other skills typically developed in earlier grades. Struggles with advanced topics reflecting inadequate mastery of foundational understanding are evidenced by algebra students struggling with basic fraction operations. Unresolved gaps in whole number understanding can cascade into fraction difficulties, which then impact success in geometry, algebra, and probability concepts. This is reflected in the ASSISTments data results, which show the 5th-grade concepts of relating volume to multiplication and addition, followed by adding and subtracting fractions, as challenging.
Recommendations
- Establish Clear Concept Terminology: Policymakers, assessment developers, and curriculum developers should collaborate to establish a shared conceptual framework for K-12 mathematics that defines consistent categorization and breakdown of mathematics concepts and associated terminology. This framework should be adopted across major assessments to enable meaningful comparisons and more accurately identify which mathematical concepts are challenging for students.
- Improve Public Access to Government Data: While PISA and NAEP provide valuable insights into mathematics performance, their data are not easily accessible. Their online tools offer a slight view with aggregate summaries but no ability to conduct detailed analyses. To support research and policy decisions, state and federal education agencies should make detailed, anonymized assessment data publicly available.
Introduction
Student proficiency in mathematics and literacy has experienced a troubling decline over the past decade, with average middle school mathematics outcomes reaching alarming lows across the United States. This deterioration in academic performance signals a crisis that threatens to undermine the educational foundation upon which students build their future success.
The mathematical challenges facing today’s students extend beyond classroom walls, as difficulties with foundational mathematical concepts can profoundly impact life trajectories and opportunities. When students struggle to master essential mathematical skills during their formative years, they face compounding difficulties that can limit their academic progression, career prospects, and overall quality of life. Understanding which specific mathematical concepts are most challenging for students to learn and understand is, therefore, critical to developing targeted interventions that can break this academic struggle.
Current mathematics performance data reveals the urgency of addressing these gaps. National Assessment of Educational Progress (NAEP) statistics demonstrate that mathematical achievement, particularly among historically marginalized populations, remains persistently below proficient, with achievement gaps that have shown little improvement over time. Research has consistently shown that passing sixth-grade mathematics serves as one of the strongest predictors of high school graduation, underscoring how early mathematical competency acts as a gateway to future educational success.
Current mathematics performance data reveals the urgency of addressing these gaps. National Assessment of Educational Progress (NAEP) statistics demonstrate that mathematical achievement, particularly among historically marginalized populations, remains persistently below proficient, with achievement gaps that have shown little improvement over time.
The COVID-19 pandemic further exacerbated these challenges by creating unprecedented disruptions to learning that disproportionately affected mathematics instruction and outcomes. Remote learning environments, reduced instructional time, and limited access to hands-on mathematical experiences widened achievement gaps and left many students with significant learning deficits that continue to impact their mathematical development. This is reflected in the NAEP Mathematics performance scores, with lower average scores for both 4th and 8th graders in 2022 than in 2019.
Given these converging factors of declining performance trends, persistent achievement gaps, the predictive power of early mathematical success, and pandemic-related learning losses, identifying and addressing the most challenging mathematical concepts in K-12 education has become an educational imperative. This research examines these critical mathematical concepts to provide educators, policymakers, and stakeholders with evidence-based insights needed to strengthen mathematical instruction and improve student outcomes across all populations.
Top Challenging Math Concepts
Despite the widespread recognition that students struggle with mathematics, there is surprisingly little comprehensive research that explores the exact concepts middle school students find most challenging. While numerous educational resources offer general explanations for why mathematics is difficult, few studies provide specific, data-driven insights into which particular mathematics concepts consistently pose the greatest obstacles for students during these critical years.
Literature Review
The existing literature reveals several recurring themes regarding mathematical difficulty, though the findings often lack the specificity needed for targeted intervention. From a narrative perspective, algebra is frequently cited as the most challenging mathematical subject, with media coverage and educational discourse consistently highlighting algebra as a critical barrier to student success. This perception is reinforced by high failure rates in high school algebra courses, leading many to view algebraic thinking as the primary mathematical hurdle students must overcome.
Geometry typically emerges as the second most commonly cited area of difficulty, particularly regarding formal proofs and spatial reasoning skills. Research examining geometry challenges has found that students struggle with the transition from concrete geometric experiences to abstract geometric reasoning, a skill that likely only begins solidifying at ages 15-16.
However, discussions of data analysis, statistics, and probability receive considerably less attention in the literature, despite these concepts being increasingly important in modern mathematics curricula. Limited research is available on probability concepts, particularly in middle school populations; however, some have suggested that middle school students have difficulty interpreting multiple pieces of statistical information. Meanwhile, it is suggested that high school students have difficulty learning basic probability concepts, fail to apply probability concepts, and do not use problem-solving skills.
Discussions of data analysis, statistics, and probability receive considerably less attention in the literature, despite these concepts being increasingly important in modern mathematics curricula. Limited research is available on probability concepts, particularly in middle school populations.
Most significantly, the cumulative nature of mathematics raises fundamental questions about whether the challenges attributed to algebra and geometry stem from inadequate mastery of foundational concepts. Educational experts have noted that many students taking Algebra 1 in high school continue to struggle with basic operations like fraction division, suggesting that the apparent difficulty with advanced topics may reflect gaps in earlier mathematical understanding due to its cumulative nature. For example, proficiency with whole numbers is required for understanding fractions, a key aspect in geometry and measurements, and challenges with fractions lead to failures in algebra. This is further supported by research on high school students’ probability understanding, which concluded that high school students had difficulty with fractions, percentage calculations, and arithmetic operations.
Data Analysis: NAEP
The National Assessment of Educational Progress (NAEP), often referred to as “The Nation’s Report Card,” provides comprehensive and reliable data on student mathematical performance across the United States. NAEP assessments are administered to representative samples of students in grades 4, 8, and 12, offering consistent measurement of mathematical achievement across five content areas: Number Properties and Operations, Measurement, Geometry, Data Analysis, Statistics, and Probability, and Algebra. The assessment’s rigorous methodology and consistent administration over multiple decades make it the gold standard for understanding trends in mathematical performance and identifying specific areas where students struggle most. We investigated descriptive differences in students’ scale scores on these content areas because even though these scale scores were not developed to be exactly the same (e.g., a score of 270 in Algebra and a score of 270 in Geometry do not necessarily indicate an exactly equal level of proficiency in each content area), these differences can suggest where relative differences in student understanding may be occurring.
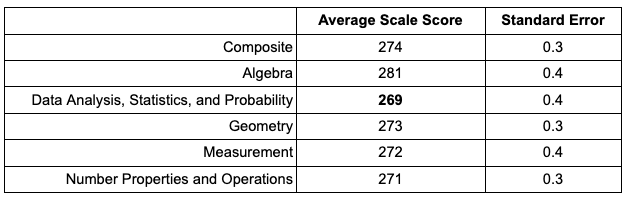
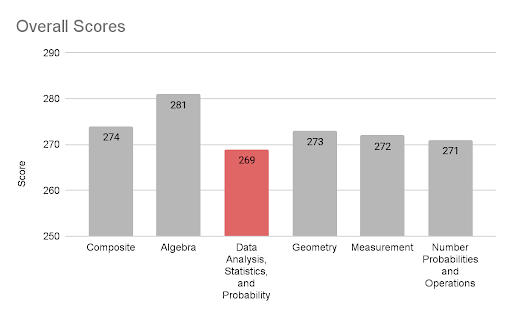
The most challenging mathematics concepts for 8th-grade students in 2022 were investigated in the NAEP data using the Data Explorer tool. Looking descriptively overall, the Data Analysis, Statistics, and Probability content area appeared as the most challenging, more so than the other areas of Algebra, Geometry, Measurement, and Number Properties and Operations. When looking at overall scores for each content area, Data Analysis, Statistics, and Probability received the lowest average score with 269, 2 points below the next lowest scoring area of Number Properties and Operations, which was followed closely by the other content areas (see Table 1 and Figure 1). One exception was Algebra, which had a noticeably higher average scale score. The Data Analysis, Statistics, and Probability content area will be highlighted in subsequent data investigations due to its having the lowest average scale score overall.
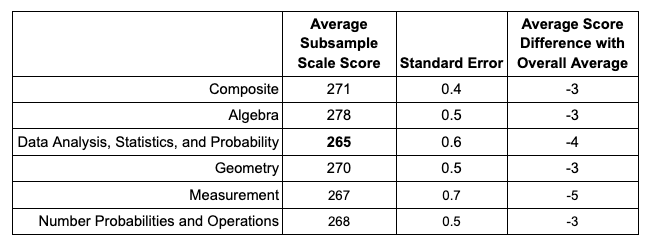
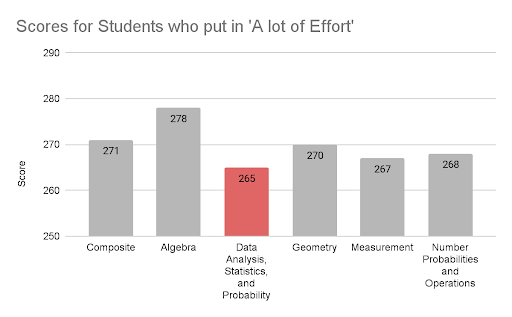
To further investigate these scores with the consideration of student effort, given that student scores could fluctuate differently for each content area based on the effort students reported putting into the test, average scores were derived for only students who reported putting in “a lot of effort” into the exam. Among all 8th-grade students who took the exam, 21 percent reported putting in “a lot of effort.” Again, the Data Analysis, Statistics, and Probability concept received the lowest average score for students who put in “a lot of effort,” with an average score of 265, followed by Measurement, which received an average score of 267 (see Table 2 and Figure 2). When considering the difference between the subsamples and the overall scores, Measurement has the largest negative difference among those who put in “a lot of effort” (i.e., those putting in “a lot of effort” had the largest difference from the overall average scores).
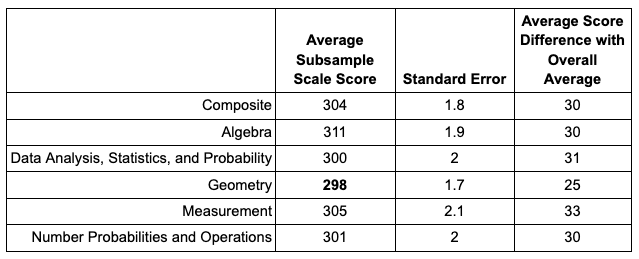
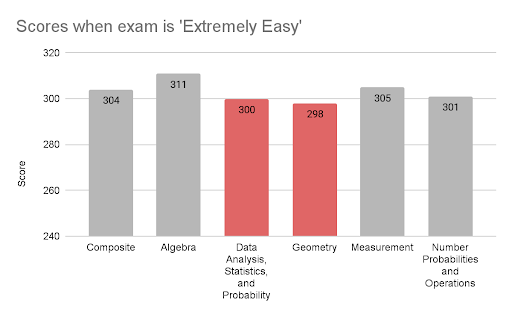
Finally, to assess the content areas that may be challenging for students with a perception of high performance, the average score for each content area was derived for students who reported that the exam was “extremely easy.” Across all 8th-grade students who took the exam, 2 percent reported they found it “extremely easy.” The average scores were higher than all students and high effort students when derived from students who found the exam to be “extremely easy,” suggesting that the perception of these students aligns well with their general mathematics performance. The concept with the lowest average score among these students was Geometry, with an average score of 298, and was followed by Data Analysis, Statistics, and Probability, with an average score of 300 (see Table 3 and Figure 3). When considering the difference between the subsamples and the overall scores, those who found the exam “extremely easy” had the smallest positive difference in Geometry from the overall average scores.
Results from the NAEP exam suggest that Data Analysis, Statistics, and Probability is a particularly challenging concept for students, even amongst those who put “a lot of effort” into the exam. However, based on average scores, Geometry also appears as a challenging area for students who are self-perceived as high achievers, identified by those who reported the exam being “extremely easy.” When considering the difference between the subsamples and the overall scores, Measurement appears most challenging to be more proficient in, despite “a lot of effort,” and Geometry has the smallest improvement in proficiency when the exam is considered “extremely easy.”
Results from the NAEP exam suggest that Data Analysis, Statistics, and Probability is a particularly challenging concept for students, even amongst those who put “a lot of effort” into the exam. However, based on average scores, Geometry also appears as a challenging area for students who are self-perceived as high achievers.
Data Analysis: PISA
The Programme for International Student Assessment (PISA) is an assessment administered by the Organization for Economic Cooperation and Development (OECD). PISA assesses 15-year-old students across participating countries every three years, focusing on mathematical literacy—the ability to apply mathematical knowledge and reasoning to solve real-world problems. Unlike traditional assessments that emphasize procedural skills, PISA evaluates students’ capacity to interpret, use, and communicate mathematical information in authentic contexts, making it valuable for identifying conceptual understanding gaps.
The most challenging mathematics concepts for 15-year-old US students in 2022 were investigated in the PISA data using the Data Explorer tool. Note that, though only US students were included in the data presented here, the PISA is an international assessment that differs from the NAEP, given the PISA’s international goals and considerations in development (vs. the NAEP’s focus on U.S. school-based mathematics standards).
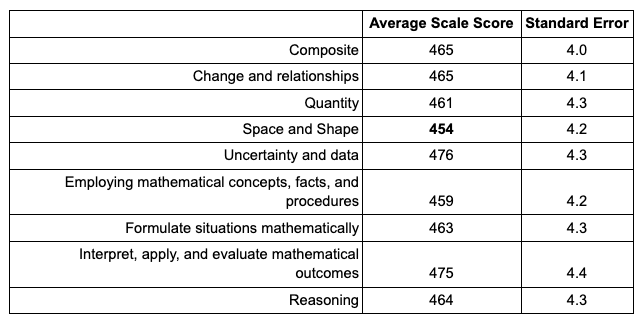
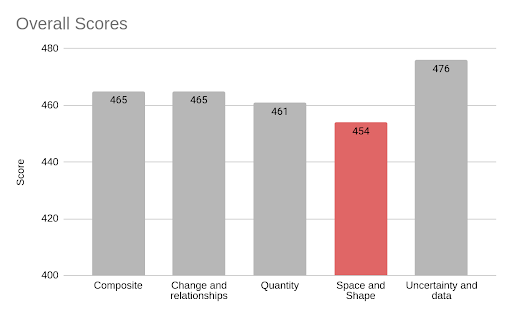
Overall, on the PISA, the content area Space and Shape appeared as the most challenging with the lowest average score of 454, more so than the other content areas of: Change and Relationships; Quantity; Uncertainty and Data; Employing Mathematical Concepts, Facts, and Procedures; Formulate Situations Mathematically; Interpret, Apply, and Evaluate Mathematical Outcomes; and Reasoning (see Table 4 and Figure 4). Also, in contrast to the NAEP results, Uncertainty and Data had the highest average scale score. While PISA includes well-developed questions that allow for a more discrete view of content areas, given that it includes a greater breakdown of topics than the NAEP, high caution should be taken in evaluating these results. PISA notes a higher exclusion rate, 6.1 percent, than their sampling standards allow. As can be seen in Table 4, high standard errors are associated with each average score, indicating high variability and a potentially inaccurate representation of the population.
Data Analysis: ASSISTments
Data from the ASSISTments platform, an online learning platform developed at Worcester Polytechnic Institute, was also used to assess middle school mathematics challenges. These data contain the number of times a student attempted to answer a question, the number of times the correct answer was provided on the student’s first attempt, and one or more Common Core State Standard (CCSS) topic tags for each item. To investigate concepts challenging for students, the rate of the first answer provided as correct was evaluated for the CCSS topics in the middle school level topics that were comprised of at least 10 items and had at least 1,000 student attempts, calculated by determining the number of times the item was answered correctly on the first attempt as compared to the number of item attempts that were graded.
The CCSS topic with the lowest rate of the first answer being correct, indicating a topic is more challenging, is relating volume to multiplication and addition at the 5th-grade level, with a rate of 50.78 (see Table 5 and Figure 5). This is closely followed by adding and subtracting fractions at the 5th-grade level. The subsequent topics for each grade level that were identified as most challenging based on the rate of the first answer provided being correct closely follow. The lack of a single topic having a distinctly lower rate of first answer correctness indicates that no clear single topic is particularly challenging for students in this dataset.
Key Findings
Data analysis, statistics, probability, and geometry are among the concepts and skills that students most often struggle to master. The analysis reveals that data analysis, statistics, probability, and geometry consistently emerge as areas of significant student difficulty. NAEP, PISA, and ASSISTments assessment data identify these content areas as substantial challenges.
The NAEP exam indicates data analysis, statistics, and probability as the most challenging topic, as indicated by the overall average score across all students being lowest for this concept, as well as the average score being lowest for this concept among students who put in “a lot of effort.” When assessing average scores among high-performing students in the NAEP exam, as identified by those who reported that they found the exam “extremely easy,” geometry was the lowest-scoring concept, closely followed by data analysis, statistics, and probability.
The PISA exam and ASSISTments platform support these concepts as being challenging for students. Average PISA scores were lowest for the space and shape topic, a common component of geometry understanding.
Of note, the PISA did not show that Uncertainty and Data was a particularly challenging content area in their sample, but that may also be due to the difference in the development and type of items provided in that assessment, with more of a focus on students’ reasoning and real-world problems. Subject matter experts found that PISA has a smaller portion of multiple-choice items than NAEP, PISA contains more higher-complexity items that more highly measure cognitive skills, and PISA places a greater emphasis on data analysis and less emphasis on algebra. The purpose of PISA is to assess students’ abilities to handle everyday situations that require mathematical skills, therefore the items are set in more real-life contexts that fit the general framework of curriculum topics, while NAEP items generally focus on a single, identifiable piece of knowledge, concept, or skill given that the assessment is focused on students’ mastery of basic knowledge, concepts, and subject-specific skills tied to broad curriculum. The study suggests that overall achievement “may be roughly comparable for making general statements regarding students’ performance, but more detailed statements about specific content areas or cognitive skills are probably not comparable.”
Student struggles in these areas may be rooted in a weak foundation in basic concepts. While data analysis, statistics, and probability, and geometry emerge as areas of student difficulty, when assessing the difference in challenges between these topics and incorporating the research, a more complex picture emerges than simply identifying problematic topics.
Concepts that are core components of geometry were also challenging for students using the ASSISTments platform: relating volume to multiplication and addition was the most challenging 5th-grade concept; area, surface area, and volume was the most challenging 6th-grade topic; constructing geometrical features figures and describing relationships between them was the most challenging 7th-grade topic; and solving problems involving volume in cylinders, cones, and spheres was the most challenging 8th-grade topic.
Additionally, the second most challenging 6th-grade topic for students in the ASSISTments platform was the relationship between independent and dependent variables, a core component of data analysis, statistics, and probability.
Student struggles in these areas may be rooted in a weak foundation in basic concepts. While data analysis, statistics, and probability, and geometry emerge as areas of student difficulty, when assessing the difference in challenges between these topics and incorporating the research, a more complex picture emerges than simply identifying problematic topics. The underlying patterns when assessing mathematics challenges across datasets suggest that struggles with these advanced concepts often mask deeper, systemic issues in mathematical preparation.
The root of student difficulties lies in weak foundational understanding rather than the inherent complexity of advanced topics themselves. The research indicates that students experiencing challenges with algebraic reasoning frequently exhibit gaps in fundamental skills such as fractional understanding and numerical fluency, competencies that should have been supported in elementary instruction. These foundational gaps create a cascading effect where each subsequent mathematical concept becomes increasingly inaccessible. With a lack of strong foundational understanding, learning challenges appear in multiple subsequent mathematical concepts.
The value of underlying knowledge extends beyond mere prerequisite fulfillment to serve as the cognitive infrastructure for mathematical reasoning. For example, students with robust foundational skills demonstrate greater problem-solving abilities. Conversely, students lacking this underlying knowledge base are forced to rely on procedural memorization rather than conceptual understanding, limiting their capacity to adapt when familiar algorithms prove insufficient. This distinction becomes particularly pronounced in higher-order thinking tasks where students must synthesize multiple concepts simultaneously—a cognitive demand that overwhelms those operating with incomplete foundational frameworks.
The interconnected nature of these findings implies that sustainable mathematical improvement demands a diagnostic approach that traces current struggles back to their foundational origins, rather than addressing surface-level symptoms of mathematical difficulty.
Mathematical difficulty demonstrates significant contextual variability that defies simple categorization. The absence of a universally “most challenging” concept reveals that student struggles are heavily influenced by multiple factors, such as instructional approaches, classroom environments, and individual learning trajectories, rather than a particular concept being universally challenging. This finding challenges the conventional practice of ranking mathematical topics by difficulty and suggests that effective mathematical intervention requires simultaneous attention to both immediate conceptual barriers and underlying skill deficits.
The interconnected nature of these findings implies that sustainable mathematical improvement demands a diagnostic approach that traces current struggles back to their foundational origins, rather than addressing surface-level symptoms of mathematical difficulty.
Recommendations
The complex nature of mathematical learning challenges requires comprehensive, multifaceted solutions that address research barriers and individual mathematical learning needs. Meaningful progress requires alignment from the field, accessible data designed to further assess these challenges, and technological aid with evidence-based strategies for students and implementation support and professional development for teachers.
Terminology Alignment
One of the most significant obstacles to advancing our understanding of mathematical learning difficulties stems from the lack of consensus regarding fundamental terminology and constructs. The mathematics education research community operates without standardized definitions for terminology such as “conceptual knowledge,” “procedural knowledge,” “mathematical concept,” and “misconception,” which can weaken a student’s understanding of a given concept and result in data differences, as data used to represent a concept are directly shaped by definitions. Definitional variability makes it nearly impossible to compare findings across studies, build cumulative knowledge, or develop evidence-based interventions that can be reliably replicated across different research contexts.
The inconsistent and non-standardized labeling of mathematical concepts and content areas is a critical barrier in comparing mathematical learning datasets. Current datasets employ different taxonomies and granularity levels when categorizing mathematical topics, making it challenging to synthesize findings or conduct meta-analyses across studies. For example, one dataset may categorize items under broad domains like “geometry” while another uses more specific labels such as “shapes and space,” “spatial reasoning,” or “measurement and geometry,” despite potentially assessing similar underlying mathematical competencies.
Inconsistent terminology extends to varying levels of specificity, where some datasets provide highly granular concept labels like “adding fractions” while others may use broad categories such as “number operations” or simply “algebra.” Labeling disparities create substantial obstacles for researchers attempting to identify patterns across datasets and compare the relative difficulty of specific mathematical concepts. Without standardized concept labeling, the field cannot effectively leverage the wealth of existing assessment data to build a comprehensive understanding of mathematical learning challenges.
Labeling disparities create substantial obstacles for researchers attempting to identify patterns across datasets and compare the relative difficulty of specific mathematical concepts. Without standardized concept labeling, the field cannot effectively leverage the wealth of existing assessment data to build a comprehensive understanding of mathematical learning challenges.
The field needs to establish consensus definitions for fundamental research constructs through collaborative efforts involving cognitive scientists, mathematics educators, and learning researchers. Organizations should convene expert groups to develop standardized operational definitions for key terms such as “concept,” “misconception,” “mathematical reasoning,” and “understanding,” ensuring these definitions are grounded in cognitive theory, education frameworks, and empirical evidence. This alignment should extend to research methodologies, including consistent frameworks for measuring conceptual understanding, categorizing student errors, and evaluating instructional effectiveness.
Additionally, data should be labeled with a standard framework, such as CCSS labeling, to ensure consistency across datasets and further generalizability of findings. When researchers operate from shared definitional foundations, the field can begin to build coherent theoretical frameworks, conduct meaningful comparative studies, and develop more targeted interventions for specific learning challenges. Such standardization would accelerate progress in identifying the most effective approaches to address persistent mathematical learning difficulties and enable more robust evidence-based recommendations for educational practice.
Research organizations and professional societies must take the lead in establishing the foundational infrastructure for evidence-based reform. Experts should convene working groups to develop standardized terminology and operational definitions for core research constructs. A commitment must be made to implementing these standards across publications, conferences, and research initiatives. Dataset labeling should be established that ensure consistent mathematical concept categorization across publicly funded research projects.
Funding agencies should prioritize grants that include multi-institutional and multi-disciplinary collaboration and adherence to standardized research frameworks, while universities should recognize and reward faculty engagement in collaborative, standards-based research initiatives. Research proposals should require the consistent use of mathematical terminology and classification systems to ensure findings can be meaningfully compared and synthesized across studies.
Data Availability
The current limitations in accessing comprehensive educational assessment data hamper deep analyses of mathematical learning challenges and the identification of targeted interventions. While international assessments like PISA and national assessments like NAEP provide valuable insights through their online analysis tools and summary reports, these platforms offer only surface-level exploration capabilities that restrict researchers to pre-defined queries and aggregate statistics. The rich, granular data underlying these assessments, including item-level responses, demographic variables, and contextual factors, remain largely inaccessible to the research community.
This limited access prevents researchers from conducting sophisticated analyses such as examining error patterns across specific mathematical domains, investigating the intersection of socioeconomic factors with particular concept difficulties, or identifying predictors of persistent mathematical misconceptions. This is particularly amplified given the distinctions of the items and assessment development between NAEP and PISA. Without access to these detailed datasets, the field cannot fully leverage the substantial public investment in large-scale assessment programs to advance our understanding of mathematical learning.
Government agencies and international organizations should establish comprehensive data sharing protocols that make anonymized, item-level assessment data easily available to qualified researchers while maintaining appropriate privacy protections. This recommendation extends beyond simply providing raw data files to include well-documented datasets with clear variable definitions, robust metadata, and user-friendly formats that facilitate analysis across different statistical software platforms.
Government agencies and international organizations should establish comprehensive data sharing protocols that make anonymized, item-level assessment data easily available to qualified researchers while maintaining appropriate privacy protections.
Such data availability would enable researchers to conduct more nuanced investigations into the specific mathematical concepts that pose the greatest challenges, examine how these difficulties vary across different student populations, and identify instructional approaches that effectively address particular learning obstacles. The democratization of these rich datasets would accelerate evidence-based research, foster collaboration among institutions with varying resource levels, and ultimately lead to more effective, targeted interventions for the mathematical concepts that prove most challenging for students.
Government agencies and policymakers hold the key to unlocking the transformative potential of large-scale assessment data. Agencies must begin developing comprehensive data sharing protocols that make anonymized, item-level assessment data publicly available to qualified researchers. This initiative should be coupled with policy reforms that reorient assessment programs from accountability-focused ranking systems to diagnostic tools that illuminate the complexities of mathematical learning. Dedicated funding should be allocated for multidisciplinary assessment analysis teams, and federally funded assessment programs should include provisions for detailed error analysis and solution strategy tracking.
Researchers and data scientists must embrace collaborative approaches that transcend institutional boundaries and disciplinary silos. The research community should establish shared data repositories and analysis protocols that enable meaningful cross-dataset comparisons and meta-analyses. These repositories should include standardized assessment data that tracks student performance across the full mathematical progression, from foundational skills like fraction operations to advanced concepts like algebraic reasoning and geometric proofs. Longitudinal datasets that follow students over multiple years would help researchers identify the specific points where foundational gaps begin to impact performance in higher-level mathematics.
Conclusion
This research paper presents the complexity of mathematical learning difficulties and the multifaceted nature of effective solutions, yet meaningful progress requires deliberate action to implement strategies that can increase student mathematical understanding and educational success across all populations.
Mathematical challenges reflect the intricate interplay between foundational knowledge gaps, terminology definitions, technological resources, and data availability. Students’ struggles with seemingly advanced topics like algebra and geometry likely trace back to incomplete mastery of fundamental concepts, while the absence of consensus regarding the “most challenging” mathematical concepts suggests that effective interventions must address the holistic nature of mathematical learning.
The question is not whether we can create more effective approaches to mathematical education, but whether we have the collective commitment to implement the coordinated reforms necessary to fully realize this potential.
Acknowledgments
The authors would like to extend their gratitude to Tom Kalil, who provided the idea for this analysis. The following individuals also provided invaluable support to the development of this paper: Perpetual Baffour (The Learning Agency), Neil Heffernan (ASSISTments), Cristina Heffernan (ASSISTments), and Bethany Rittle-Johnson (Vanderbilt University).

L Burleigh